
[PDI 워킹페이퍼 No.17] Foreign Aid, Violence, and Electoral Support in Developing Countries: Experimental Evidence from the Philippines
한준영 (고려대학교 정치외교학과 석사과정)
Abstract
Election-related violence is rampant in many developing countries that receive foreign aid. Although voters often elect representatives associated with violence in the developing world, little is known why they do that. In this article, I investigate why voters support politicians who resort to violence. I argue that the poor tend to vote for a candidate who delivers tangible local benefits through foreign aid projects even when the candidate uses violence in elections. To test this argument, I conduct a nationwide survey in the Philippines, inserting experiment about the effects of foreign aid and violence on voters’ electoral support. I find that poor voters residing outside the national capital region are more likely to support the candidate who has offered foreign aid projects to her constituency, regardless of her alleged electoral violence. This research sheds light on the mechanism linking poverty to electoral violence in less-developed countries. It also reveals unintended consequences of foreign aid for increasing the likelihood of violence.
Introduction
Electoral violence can result in many causalities and undermine the democratic institutions of developing countries.1 According to the recent data on election-related violence, 804 (30.1%) elections out of 2,667 held around the world from 1975 to 2021, had at least one aspect of violence (Besaw and Frank 2021). Among them, electoral violence has caused “thousands of casualties, population displacement, and protracted political crises, as in Kenya, Nigeria and Zimbabwe”(Gutierrez-Romero and LeBas 2020, 77). Also, it has undermined democratic institutions so severely that violence has become a routine of election in many developing countries such as Thailand and the Philippines.
Despite these costs, voters in developing countries routinely elect candidates associated with violence. In the Philippines, for instance, Melecio Yap Jr. has been a congressman of Negros Occidental’s 1st congressional district from 2016 to 2019, and mayor of Escalante city from 2007 to 2016 and from 2019 to present, even though in 2016, he was charged for the murder and frustrated murder of supporters of his political rival from 2007 to 2011.2 In the other region, Carmen Loreto-Cari, former mayor of Baybay city and 3-term congresswoman, and her son, Jose Carlos Loreto-Cari, have been swapping positions in the city and congress despite being under suspicion of masterminding for an assassination attempt against a rival politician in the 2013 election.3
What explains the electoral success of legislators who are alleged to use violence? Previous explanations primarily focus on the expected benefit from the violent candidate. They argue that the voters are more tolerant of the violent candidates with the same ethnicity or partisan affiliation, expecting that they might bring benefits if elected (Chandra 2004; Chaturvedi 2005). In a similar vein, many existing works find that the core supporters of violent politicians would not sanction him although they might blame the use of violence in the abstract (Collier and Vincente 2012; Hafner-Burton, Hyde and Jablonski 2014; Lynch 2014). In other words, voters might be willing to accept negative signals of the candidate if expected benefits from her are sufficiently large (Winters and Weitz-Shapiro 2013).
This line of research predicts that the poor voters would be more likely to endure candidate’s misconduct such as violence or corruption because “almost universally, clientelism is an exchange between politicians and their poor clients” (Weitz-Shapiro 2012, 570). However, empirical evidence is mixed. On the one hand, scholars find that, contrary to the conventional wisdom, poor voters in India do punish candidates with a record of crime or corruption (Banerjee et al. 2014), or even sometimes, in Brazil, they have a more powerful negative reaction to information about corruption than upper-class voters (Winters and Weitz-Shapiro 2013). On the other hand, however, from the vignette experiment in Kenya, other scholars find that poor voters are less likely to punish the candidate rumored to use violence in the previous election than their wealthier counterparts (Gutierrez-Romero and LeBas 2020).
I suggest that these existing works have limitations in mainly two aspects. First, they have not paid much attention to heterogeneity in the preferences of poor voters. For example, poor voters living in the area where the level of social spending is relatively high, they might be less prone to the candidate’s political mobilization with tangible benefits since their basic needs can be fulfilled by existing public goods or social services. If this is the case, they might be more willing to forgo benefit from the politician in the face of a criminal or violent background of her. Second, previous works have not considered various forms of benefits that candidates might offer, or voters might be aware of, in the real world. For example, as I would show later, foreign aid in developing countries often offers basic public goods and local social services from which the constituents can benefit. However, there is much less research that investigates the effect of these diverse forms of benefits on the probability of voting for the candidate with negative attributes.
Therefore, I aim to contribute to this literature by considering another important factor that might affect vote choice for the violent candidates in developing countries: foreign aid. Different from the clientelistic benefits, “which are targeted at the individual and linked to individual political behavior” (Weitz-Shapiro 2012, 569), foreign aid is more close to local benefits, or ‘pork’, in that politicians in developing countries frequently claim their credits in securing foreign aid projects or budget, and this leads to attracting more votes (Cruz and Schneider 2017; Ahmed 2012; Jablonski 2014; Knutsen and Kotsadam 2020). Also it is widely known that “aid can help recipient governments to stay in office by enabling them to maintain patronage and services” (Carnegie and Marinov 2017, 672). Despite this well-established electoral effect of foreign aid in less developed countries, however, there is much less research focusing on how it might affect voting behavior on a candidate with a criminal or violent backgrounds.
I try to fill this gap by arguing that the poor living in less-developed regions tend to vote for a candidate who delivers tangible local benefits through foreign aid projects even when the candidate uses violence in elections. Focusing on the role of foreign aid as a source of local public goods and basic social services provision, I predict that poor voters living in outside of the national capital region (NCR) will be more likely to vote for the violent candidate when she has a record of receiving foreign aid project in the district. In contrast, I predict that such a positive effect of foreign aid on the probability of voting for the violent candidate will not emerge among the voters living in the NCR or the voters living in the non-NCR but have higher income levels.
I test this theory using a survey experiment embedded in a nationwide online survey that explores individuals’ voting intentions for their legislators in the Philippines. This experimental approach has the advantage of testing the effect of foreign aid on the probability of voting for a violent candidate. Because the treatment is exogenously assigned, whether a respondent learned the candidate is rumored to use violence or got foreign aid project in her district is designed to be orthogonal to the individual attributes of voters, specifically their previously held views about foreign aid and violence. My treatment not only provides the respondent with a realistic amount of information on the foreign aid and the rumor of using electoral violence, but it also tests the impact of aid and violence on voting behavior. A main finding is that, while receiving foreign aid benefits and using violence harms the incumbent’s electoral fortune, the voters react differently to the trade-off between the positive and the negative attributes according to their residential area and economic status. Only poor voters living in non-NCR are more likely to reward the violence-related incumbent when they know she has a record of receiving foreign aid before. I find that these findings are robust to alternative explanations and measurement.
These findings imply that the electoral success of violent candidates likely reflects voters’ preferences for local public goods. While previous works find that the economic status of voters matter, they have little empirical consensus on when and how it matters. This study contributes to this literature by elaborating not just income level is important, but the environment where voters live is also important. This suggests that the regional capacity for providing local public goods and basic social services can be crucial in deciding whether or not poor voters would have the incentive to cast their vote for violent candidates. If there is a shortage of basic public goods and social services, poor voters’ demands for them would be high enough to ignore the misconduct of the candidate. I show this is true by illustrating that the positive effect of foreign aid treatment on the probability of voting for the candidate decreases as the capacity of providing public goods by respondents’ regional government gets greater.
Moreover, the results show that violence-related candidates might have an incentive to leverage these voters’ demands with foreign aid. Pre-existing studies have revealed that in less-developed countries, politicians keep claiming their credit in receiving foreign aid, and it helps them reelected (Cruz and Schneider 2017; Jablonski 2014). The results corroborate experimental evidence of this argument, and I further show foreign aid can mitigate the negative effect of electoral violence especially for poor voters living in non-NCR. This implies that donors and international NGOs might face a trade-off in implementing community-driven development projects. While these projects would provide basic public goods and social services in less-developed regions, at the same time, they can be exploited for electoral purposes by violence-related local politicians.
Local public goods provision, foreign aid, and voters’ preference
To understand why voters vote for a violent candidate, it is important to examine what affects voters’ preferences. Since legislators’ foremost interest lies in being re-elected, they respond to what their constituents want (Bailey 2001; Denzau and Munger 1986). Moreover, politicians do so even when constituent preferences are unorganized (Milner and Tingley 2010). So, to investigate what voters want, and what affects their preferences is a crucial step toward revealing why violence-related candidates keep being elected in developing countries.
Regarding voter preferences, previous works primarily focus on the economic status of voters because material interest is known as important predictor of voter policy preferences (Alesina and Ferrara 2005; Inglehart 2007). Research shows that poor, less-educated voters tend to prefer clientelistic and materialistic benefits over programmatic ones (Shin 2015; Nathan 2016; Kitschelt 2000). The reason why poor voters demand clientelistic benefits more than their wealthier counterparts might be because they need them more, or they are more risk-averse, or have shorter time-horizon (Stokes 2009; Keefer and Khemani 2005). Also, previous works find that poor voters are the main targets of vote buying and clientelism in developing countries (Jensen and Justesen 2014; Stokes et al. 2013). These findings predict that the poor will be more likely to vote for candidates with criminal records when they are expected to offer tangible local or individual benefits.
However, empirical evidence is mixed. Banerjee et al. (2014) finds that, regardless of their caste, poor voters are less likely to vote for criminal candidate. In the similar vein, Winters and Weitz-Shapiro (2013, 423) reveals that “respondents in the lowest classes have a powerful negative reaction to information about corruption” regardless of “candidate’s record of completing many public works projects during his term”. In more recent work, in contrast, Gutierrez-Romero and LeBas (2020) finds that respondents who have four or fewer assets from a list of 15 durable assets, do not penalize candidates for their rumoured involvement in electoral violence while respondents who have more than four durable assets do. As inconsistency in the results of previous experimental studies illustrates, the economic status of the voters alone seems not enough to explain electoral performances of the criminal or violent candidate. These inconclusive findings suggest that further research is needed to find under which conditions the poor voters become more tolerant of criminal or violent candidate.
In this paper, I aim to contribute to this debate by arguing that foreign aid and the level of basic public goods and social services in the residence can matter. Specifically, I argue that poorer voters in regions outside the national capital region (non-NCR) are more likely to vote for a candidate who has offered foreign aid projects to her constituency, regardless of her alleged electoral violence. In contrast, I argue that voters in the NCR and richer voters in non-NCR are less likely to vote for a candidate who is associated with electoral violence, regardless of her delivery of foreign aid projects. In sum, a main task of this paper is to see whether the effect of foreign aid on the probability of voting for the candidate is conditional on her use of violence, and how this conditional effect varies by voter’s characteristics. My arguments based on the two main assumptions: (1) Voter demand for basic public goods and social services is a function of the actual level of them in the region, and (2) foreign aid can be a source of basic public goods and social services in developing countries.
First, voters living in less-developed regions where local public goods are underprovided will demand them more than their counterparts living in more-developed regions where local public goods and services are provided sufficiently. In most developing countries, a large share of public goods and social services is concentrated in the NCR. In contrast, regions outside the NCR often have difficulty in providing an adequate levels of public goods and social services to citizens because local government has limited sources of tax revenue, and the development priority of central government is usually on the NCR. Indeed, in the Philippines, the level of government final consumption expenditure(GFCE)4 by regions, one of the indicators for regional capacities of providing public goods, illustrates that there is a huge gap in the capacities between the NCR and non-NCR. For example, as you can see from the Appendix G, average per capita GFCE in the non-NCR was 18.5 Philippine peso while per capita GFCE in the NCR was 82.1, greater than four times of non-NCR per capita GFCE.
Other indicators also imply that the non-NCR residents’ demand for basic public goods would be greater than that of the NCR residents. For examples, in 2018, average hospital beds per 10,000 population in non-NCR was 6.1 while it was 13.5 in the NCR. Considering the figure was 7.9 for Bangladesh, 9.0 for Cambodia, and 15.0 for Laos, non-NCR has fairly weak health care.5 Also, average student-teacher ratio in non-NCR was 26.2 while it was 21.5 in the NCR while the figure was 26.0 for Thailand, and 22.0 for Laos.6 Both average hospital beds per 10,000 population and student-teacher ratio indicate that non-NCR residents might be more likely to demand for medical and educational services from the government. However, not all the voters residing in non-NCR demand basic public goods or social services at the same level. For richer voters, they can afford quality services from the private market. Therefore, I expect that the most vulnerable type of voters to local benefits by the candidate would be the poor voters living in the non-NCR where local public goods and basic social services are underprovided.
Next, in many developing countries, foreign aid is an important source for basic public goods and social services provision. The vast majority of previous works find that foreign aid can be an important resources for politicians in recipient countries, and therefore, they leverage it to remain in the office longer (Dreher et al. 2019; Ahmed 2012; Jablonski 2014; Cruz and Schneider 2017). In line with this research, I expect that some types of foreign aid, for example, community-driven development projects, can boost local politicians’ electoral success by providing essential, basic public goods and social services needed by local constituents.
Having set the Millennium Development Goals (MDGs), there has been rising concern about how to satisfy the actual needs of the poor rural people since they and the local organizations that represent them, often lack the capacity to develop and articulate their needs.7 Also, facing critics of “big development” that criticize large and government-initiated projects perform poorly, scholars and practitioners began to promote participatory, small-scale development. In this context, community-based development approach has become an important tool that can help find, scale-up, and effectively satisfy the actual needs of the beneficiaries in the recipient countries. Community-based development “is an umbrella term for projects that actively include beneficiaries in their design and management”, and “The World Bank’s lending for such projects has risen from $3 billion in 1996 to $7 billion in 2003” (Mansuri and Rao 2004, 2). In 2020, there were 327 active community-based development projects in 90 countries for a total lending of $33 billion.8
Since this form of foreign aid is based on the small-scale and the actual needs of recipients, the projects often include providing basic public goods and social services in remote, local area of developing countries. Also, these projects usually aim to deliver and implement quality development projects, and benefit the poor populations in the region. So, foreign aid can play an important role as providing basic public goods and social services, and poor voters in need would be the main targets of the projects. At the same time, previous research finds that the voters in developing countries often credit receipt of foreign aid to local politicians, even when aid allocation is nothing to do with politicians’ capacity or performance (Cruz and Schneider 2017).
As a result, I expect that poor voters will be more tolerant of violence when the candidate brings foreign aid project in her district. However, since the demand for basic public goods and social services would be much lower in the NCR, I predict that only poor voters living in the non-NCR will be willing to embrace violent candidate for local benefits. In sum, I expect a violent candidate has an incentive to mitigate her negative impression with receipt of a foreign aid project, and poor voters with limited access to local public goods and basic social services will be willing to vote for her.
Hypothesis 1 : Poorer voters in non-NCR are more likely to vote for a candidate who has offered foreign aid projects to her constituency, regardless of her alleged electoral violence.
However, I expect that the positive effects of foreign aid on the probability of voting for the violent candidate would not emerge among the voters in NCR and richer voters in non-NCR. First, for voters in NCR, the marginal benefits brought by increased basic public goods and social services would be small compared to voters in non-NCR since it already has sufficient level of them. So, additional basic public goods and social services from the foreign aid projects would not be enough to make NCR voters be willing to vote for violent candidate. Second, richer voters in non-NCR are neither the main targets of the foreign aid projects nor demanders of basic public goods and social services. Also, they can afford more quality goods and services in the private markets. Therefore, I expect that foreign aid project would not increase the probability of voting for the violent candidate among richer voters in non-NCR.
Hypothesis 2 : Voters in NCR and richer voters in non-NCR are less likely to vote for a candidate who is associated with electoral violence, regardless of her delivery of foreign aid projects.
Research setting
To test the hypotheses, I conduct a survey in the Philippines, which is well-known for the practice and prevalence of election-related violence. From 1986 to 1998, on average, more than 100 people had been killed in each election (Patino and Velasco 2004). In the 2001, 2004, and 2007 elections, there had been a total 269, 249, and 229 election-related violence incidents, respectively, and more than one hundred people were killed before and after the elections of each year (ACE 2007). The death toll has been on a declining trend since 2007, but as one can see from the 2009 Maguindanao massacre, in which 58 people were gunned down at the order of the incumbent,9 and 43 incidents with 73 victims in the most recent election in 2019,10 the country is still experiencing violent elections.
At the same time, the Philippines “has been one of the largest recipients of foreign aid from bilateral donors such as Japan and the United States, and also from multilateral donors such as the World Bank and the Asian Development Bank” (Mitra and Hossain 2013). In 2019, the Philippines received 905 million dollars of net official development assistance (ODA), which was 0.22 % of its gross national income (GNI).11 More importantly, there are several less-developed regions in the Philippines whose local economy is highly dependent on foreign aid. For example, in 2014, the proportion of ODA disbursed to region to gross regional domestic product (GRDP) was 10.5% for the Eastern Visayas (Region VIII), 8.4% for the Autonomous Region in Muslim Mindanao (ARMM), 7.8% for the Caraga (Region XIII), and 7.7% for the Mimaropa (Region IVB).12
Also, regarding community-based development projects by the World Bank, these less-developed regions have more projects than others in terms of both the number of projects and the amount received.13 From 2014 to 2018, the Western Visayas had received 4,696 projects worth 9.5 million dollars, the Eastern Visayas had received 6,337 projects worth 9.6 million dollars, the Caraga had received 1,557 projects worth 4.3 million dollars, and the Mimaropa had received 1,690 projects worth 4.1 million dollars.14 Considering the annual GRDP of Eastern Visayas, Caraga, and Mimaropa in 2014 was 5.8, 3.1, and 4.2 million dollars respectively, the amount of community-based development projects in the impoverished regions is quiet huge. Also, the development projects have improved access to local public goods and services, and the quality of residents’ life in the regions. For example, the regions that had been selected as the beneficiaries for community-based development projects, have higher rates of school participation rates and employment rate, and better access to safe water and health services (Edillon et al. 2011). In addition, from 2014 to 2020, there has been 8% increase in access to roads, school, health centers and clean water in the municipalities received community-based development projects, compared to others who were not selected for the projects.15
From the theoretical perspective, the case of the Philippines is suitable for analysis since it has a deep-rooted political system represented by clientelism and pork-barrel politics, and also politicians often have criminal or violent background. Especially, Cruz and Schneider (2017, 396) finds that “incumbents in the Philippines undeservedly take credit for the receipt of foreign aid and thereby boost their chances of reelection”. They reveal that incumbents received development aid projects “significantly increased the frequency of their visits to the project sites and pursued a number of strategies to appear influential in the allocation of the project funds” although they could “neither affect the likelihood of selection for the project nor directly divert project funding” (Cruz and Schneider 2017, 396-397). So, for testing my hypotheses, the Philippines offers appropriate conditions since candidates’ receipt of foreign aid and rumor of using violence are common attributes that ordinary voters encounter in the election periods.
In addition, as I illustrate in the previous section, when I compare the number of hospital beds per 10,000 population, student-teacher ratio, and government final consumption expenditure per capita between NCR and non-NCR, regional imbalance in the capacity of providing public goods and social services is huge. This regional gap offers a good background for testing my hypotheses. Also, while the geographical background of most of the literature is biased toward African countries and India, electoral violence is global phenomenon with varying degrees and various forms. So, analyzing the case of the Philippines can shed light on the relatively unraveled aspects of electoral violence and its cause because election-related violence in the Philippines is usually not based on ethnicity, caste, or party affiliation, as in most African countries and India, but rather it is based on the more personalized motivation or political clan. Moreover, pervasive clientelism and pork-barrel politics in the Philippines offers a good opportunity to assess how community-based foreign aid project can help incumbent with bad attributes gain popular votes.
Experimental design
I embed experiment in the survey to randomize treatment across individuals. This allows me to test the causal mechanism linking a candidate’s attributes to the perceptions of individual voters. Survey experiment was conducted between July 20 and August 20, 2021. Respondents were randomly recruited on the quota basis of age and gender from the Philippines nationwide subject pool registered at an international survey company Qualtrics. Respondents who are Filipino, residing in the Philippines, and whose age is above or equal to 18 participate in the study. In total, 1,632 Filipinos completed the survey. Respondents were asked demographic and political questions that are widely used in the literature. Appendix A presents descriptive information for respondents.
My main question was a survey experiment testing how the respondent’s intention to vote for the incumbent candidate with violent background was affected by the candidate’s receipt of foreign aid. Before receiving the main treatment, all respondents were asked to imagine a candidate in their constituency for a Member of Parliament. To equalize the candidate’s qualifications and promises, all respondents were told:
Imagine that there is a candidate for the 2022 House of Representatives elections in your constituency. This candidate has been elected member of the House before in another constituency similar to yours in the 2019 elections, and the candidate is promising to improve the economy of your community.
To reduce the possibility of socially desirable responses I did not mention explicitly the candidates’ party affiliation or ethnicity. The key manipulation is information about the incumbent’s record of receiving foreign aid projects in his district, or rumors of using electoral violence during the last election. For respondents in baseline, they were just told the above script only. For respondents in aid-only condition, adding to the baseline information, they were told about the information about the foreign aid project that the candidate’s district was selected to receive. For respondents in violence-only condition, adding to the baseline information, they were told about the information that the candidate is rumored to have ordered the murder of a rival politician to win the last election. For respondents in the last experimental condition, adding to the baseline information, they were told about both foreign aid and rumor of violence information, as described in the aid-only condition and violence-only condition. Verbatim instructions and vignettes can be found in Appendix B.
The manipulations are realistic in that the vignettes are created based on actual foreign aid projects implemented in the Philippines, and one of the most common forms of information about election-related violence that Filipino voters would encounter. For foreign aid treatment, I use KALAHI-NCDDP (Kapit Bisig Laban sa Kahirapan – National Community Driven Development Program), a $663.90 million project co-funded by the World Bank. This foreign aid project started in 2014 and ended in 2019, as an extension of another community-driven foreign aid project, KALAHI-CIDSS (Comprehensive and Integrated Delivery of Social Services). KALAHI-NCDDP intended to empower communities in the targeted areas to achieve improved access to services and to participate in more inclusive local planning, budgeting, and implementation (World Bank 2014). The largest share of the funding was spent on investment grants that supported community sub-project investments and activities. Based on the community-identified priorities, the project funded community-based public infrastructure and services such as roads, bridges, schools, daycare centers, etc.
Following the logic of Cruz and Schneider (2017), I choose KALAHI-NCDDP as foreign aid treatment because “it is explicitly designed to prevent the misappropriation of funds by national and local politicians by allocating funding based on a poverty formula and releasing funding directly to the villages”. Therefore, local politicians have much less control over both the awarding of projects and the subsequent allocation of funding (Cruz and Schneider 2017, 400). To reflect this neutrality of the program, I carefully choose wordings of ‘district was selected […] by the World Bank’ in vignette to minimize the possibility that respondents might think the candidate attracted or deserved it.16 This strategy will offer a hard test for my hypothesis since the effect of foreign aid often comes with the capture of funding and explicit credit-claiming by politicians (Cruz and Schneider 2017; Jablonski 2014). Also, I decide to choose 200,000 US dollars as the amount of money spent on the project by averaging the number of grants per subgroup project implemented in 2019.
For violence treatment, I specify that the candidate is rumored to have ordered the murder of a rival politician to win the previous election. This information delivers quite strong allegations against the candidate to the readers, compared to other more common forms of electoral violence such as coercion, threats, or intimidation. I also give additional information that the candidate has not been arrested for the alleged crime because this is what normally happens in the Philippines. So, my design offers a lower bound for investigating the effect of foreign aid on the probability of voting for a violent candidate since I use relatively weak foreign aid manipulation while using relatively strong electoral violence manipulation. As a result, in testing whether the foreign aid has a positive impact on the voting intention for violent candidate, this experimental design is quiet conservative.
Despite careful consideration in choosing the content and question wordings of the vignette, still, there can be criticism about the hypothetical nature of the experiment. One concern is related to the inaccuracy of responses on the questions regarding the hypothetical situation (Cummings et al. 1995). While there is debate on this issue, some scholars have shown that respondents can give meaningful answers to hypothetical questions if “don’t know” option is provided and if questions allow participants to make link their experiences to the hypothetical (Mitchell and Carson 1989, cited from Jensen et al. 2014). I include “don’t know” option in the survey, and I believe that the vignette captures the realistic aspects of information that ordinary Filipino voters might encounter in most elections. Another possible criticism might come from the desirability bias which the information about violence is likely to cause. However, since this bias would underestimate the effect of foreign aid on the probability of voting for the violent candidate, I believe that this is not a great problem in analyzing the results.
To isolate the effect of the candidate’s rumor of using violence and receipt of foreign aid from the respondent’s characteristics, I assign respondents randomly to one of four experimental conditions. Randomization was well implemented despite a minor imbalance. I conduct ANOVA tests to see whether or not the mean value of each variable listed in Appendix A varies across the four experimental conditions. As reported in Appendix C, the mean values do not statistically vary at the 5% significance level, except the ones for Tagalog. To address these unbalanced covariates on some factors, after demonstrating the comparison of means of four groups, I provide results from regression including variables listed in Appendix A as controls.
To estimate the effect of foreign aid on the probability of voting for the violent candidate, I rely on survey item asking respondents their voting intention for the candidate. As for the outcome variable Vote, after the vignette, I asked respondents to indicate whether or not they will vote or not for the candidate. It is coded as 1 if respondents say “Yes”, and 0 otherwise.
Who tends to vote for a violent candidate?
As a first cut, I provide a comparison of the means of these four groups based on the dependent variable, Vote. As you can see from Figure D1 in Appendix D, receipt of foreign aid project increases the likelihood of voting for the candidate by about 18%p (changing the mean from 0.60 to 0.76), while rumor of using violence decreases the likelihood of voting for the candidate by about 48%p (changing the mean from 0.60 to 0.12). However, when I compare the mean of ‘Violence only’ group to ‘Aid and Violence’ group, I cannot reject the null hypothesis that the mean of the two groups is the same at the 5% significance level. In other words, for entire samples, I find that receipt of foreign aid has no positive effect on the probability of voting for the candidate with a rumor of using violence.
However, when I divide samples by residential area and household monthly income level, I find that the poor voters living in the non-NCR tend to vote for the violent candidate when her district was selected as a recipient of the foreign aid project. To compare the mean value of Vote by different treatment conditions and groups, I run a two-sample t-test. Results of the t-test are reported in Table D1, and Figure 1 is drawn from the table. In Figure 1, only among respondents living in non-NCR and with household monthly income below 10,001 Philippine pesos (lower-left panel), a mean value of Vote is higher in ‘Aid and Violence’ condition than in ‘Violence only’ condition (p = .02). This implies that in line with my theoretical prediction, candidate with the rumor of using violence can have electoral support from the poor voters living in non-NCR by her district being selected as receiving foreign aid project. For respondents living in NCR and living in non-NCR but with higher household income, however, there is no such positive effect of foreign aid on the probability of voting for the violent candidate.
Figure 1. The proportion of respondents who vote for the candidate by residential area and household monthly income level
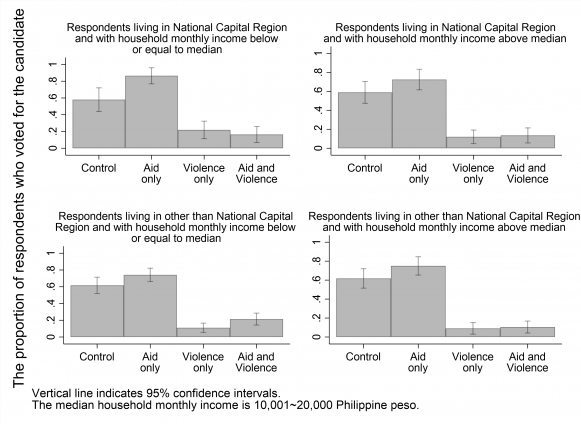
I also find that when there is no rumor of violence, poor voters reward foreign aid in general. Specifically, when I compare ‘Aid only’ group to ‘Control’ group, only respondents with household monthly income below or equal to the median, are more likely to vote for the candidate, whether or not they live in NCR or not. For poorer respondents living in NCR (upper-left panel), candidate’s district being selected as a target of the foreign aid projects, increases the likelihood of voting for her by about 28% (changing the mean from 0.58 to 0.86). Similarly, for poorer respondents living in non-NCR (lower-left panel), the likelihood increases by about 12% (changing the mean from 0.61 to 0.74). However, there is no such positive effect of foreign aid on the probability of voting for the candidate for wealthier voters, whether or not they live in NCR or not. I cannot reject the null hypothesis that the mean of Vote between ‘Control’ group and ‘Aid only’ group is same for wealthier voters at 5% significance level. This finding suggests that the previous works’ finding of electoral gain from receiving foreign aid, is largely driven by poor voters.
Next, I regress dependent variable, Vote, on covariates in Appendix A.17 Since the dependent variable is binary, I run logistic regression. First, as you can see from the Appendix E, information about receiving foreign aid project alone has positive effect on the probability of voting for the candidate while information about alleged electoral violence alone has negative effect on the probability of voting for her. To see how voters’ income level and residential area matters for their voting choice, I divide samples by their household monthly income level and residential area. Figure 2 shows the predicted probabilities of voting for the candidate by experimental conditions, residential area, and household monthly income level.
Figure 2. Predicted probability of voting for the candidate by treatment conditions, residential area, and household monthly income level
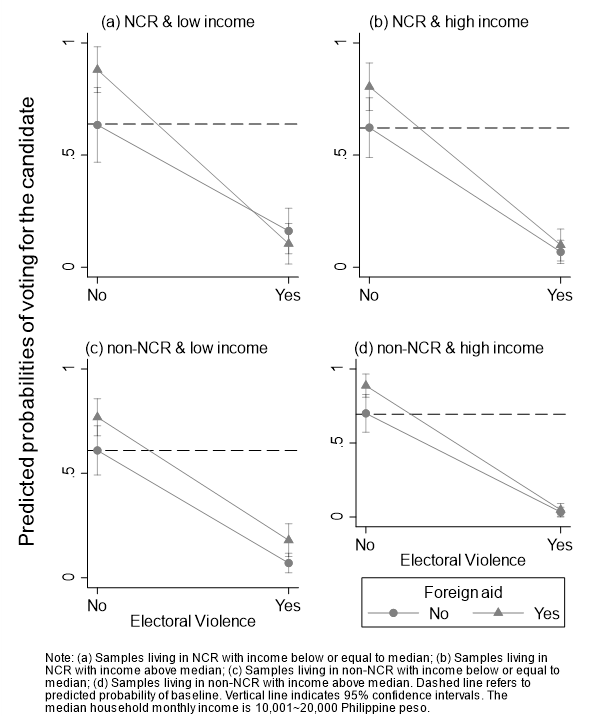
Table 1. The marginal effect of foreign aid on the predicted probabilities of voting for the candidate by residential area and household monthly income
| (1)
NCR & low income |
(2)
NCR & high income |
(3)
non-NCR & low income |
(4)
non-NCR & high income |
|
| Electoral Violence = No | 0.24* (0.10) |
0.18* (0.09) |
0.16* (0.07) |
0.19* (0.07) |
| Electoral Violence = Yes | -0.06 (0.06) |
0.03 (0.04) |
0.10* (0.04) |
0.01 (0.02) |
Standard errors in parentheses. * p<0.05
The X-axis refers to whether or not respondents receive information on the candidate’s rumor of using violence, and both solid circle and triangle refer to whether or not respondents receive information on the candidate’s record of receiving foreign aid projects before. Therefore, each point on a panel refers to predicted probabilities according to four different experimental conditions. For example, when a pointer is a solid circle and located on the left of the x-axis, it refers to the predicted probabilities of baseline respondents while when a pointer is a triangle and located on the right of the x-axis, it refers to the predicted probabilities of respondents assigned to ‘Aid and Violence’ group. My main interest lies on the right of the x-axis and a gap between the two shapes because the gap refers to the marginal effect of foreign aid on the predicted probabilities of voting for her when the candidate is rumored to use violence. I report this marginal effect of foreign aid in Table 1. Full regression results for making Figure 2 and Table 1 are reported in Appendix F.
Here, I again confirm the findings from the mean comparisons for the probability of voting. Only the poor voters living in the non-NCR (lower-left panel) reward the violence-related candidate when she has a record of receiving foreign aid projects (p = .04). Specifically, receipt of foreign aid increases the probability of voting for the violent candidate about by 10%p (changing the probability from 0.07 to 0.17). However, for NCR residents and richer voters living in non-NCR, foreign aid has no such positive effect on the probability of voting for the violent candidate. I cannot reject the null hypothesis that the marginal effect of foreign aid is zero when the candidate has a violence-related rumor. In sum, these results illustrate that poorer voters in non-NCR are more likely to vote for a candidate who has offered foreign aid projects to her constituency, regardless of her alleged electoral violence. In contrast, voters in NCR or richer voters in non-NCR are less likely to vote for a candidate who is associated with electoral violence, regardless of her delivery of foreign aid projects.
Robustness checks
In this section, I test observable implications from main findings, and whether the findings are robust to possible alternative explanations and other measure for one’s economic status. One of observable implications from my findings is regional capacity of providing public goods matters. I find that the poor voters residing in non-NCR are more likely to support the candidate who has offered foreign aid projects to her constituency, regardless of her alleged electoral violence because non-NCR has lower level of public goods. However, some might point that comparison between NCR and non-NCR is not appropriate since this could ignore heterogeneity among regions outside the NCR, and the findings might be mainly driven by NCR’s exceptionally high capacity of providing public goods. To deal with this concern, I focus on the regional variations among regions outside the NCR. If my prediction still holds within non-NCR, poor voters living in the region where a capacity of providing public goods is low will be more likely to support for the violent candidate when she has offered foreign aid to her constituency, compared to richer voters living in the regions with similar capacities or voters living in the region with higher capacities.
To see whether this prediction holds, I collect the data on government final consumption expenditure per capita in 2020 by regions from the Philippine Statistics Authority, and divide non-NCR samples by the level of expenditure and household monthly income. As you can see from logistic regression results in Figure H1 and Table H1 in Appendix H, poor voters residing in the region where the level of per capita government expenditure is below or equal to the median, are more likely to vote for the violent candidate when she has received foreign aid project. Neither voters living in regions with a high level of per capita government expenditure nor richer voters living in regions with a low level of per capita government expenditure show such a pattern.
Also, with same logic applied, I expect that for poor respondents living in non-NCR, the positive effect of foreign aid treatment on the probability of voting for the candidate will decrease as the regional capacity of providing public goods gets greater. However, for richer voters living in non-NCR, there would be no such variations in the effect of foreign aid treatment since they can afford necessary goods and services in the private markets, and therefore, have lower demands for public goods and social services offered by the government. To see whether this holds, I analyze how the effect of receiving foreign aid on the probability of voting for the candidate varies by GFCE per capita. Each point on Figure H2 in Appendix H represents marginal effect of foreign aid treatment on the probability of voting for the candidate by different level of per capita GFCE for non-NCR voters. Also, at the same time, each point represents actual per capita government expenditure by regions outside the NCR.
As you can see from the figure, for respondents who are living in non-NCR and with lower household income (left panel), the effect of foreign aid treatment on the probability of voting for the candidate is positive and statistically significant when they are living in the regions where the level of GFCE per capita is below 23.9 Philippine pesos, regardless of the candidate’s rumor of violence. However, for poor respondents living in CAR or Eastern Visayas, top two in terms of GFCE per capita following NCR, there is no such positive effect of foreign aid receipt by the candidate on the probability of voting for her. For richer voters living in non-NCR (right panel), marginal effect of foreign aid treatment on the probability of voting for the candidate is not distinguishable from zero at every level of per capita GFCE, whether the candidate has rumor of violence or not. This findings suggest, in line with my theoretical predictions, regional capacity of providing public goods matters for poor voters’ voting decision when they encounter possible local benefit from the foreign aid and negative attribute of the candidate.
Next, I test other alternative explanations. One possibly argues that the pattern I revealed is not because of the difference in the income level, but because of the difference in the level of political interest, or sophistication. For example, on the one hand, respondents with the lower level of interest and knowledge in politics may not know seriousness of the electoral violence, and therefore, they might be more tolerant of violent candidate. On the other hand, some previous works find that the more informed voters are more likely to be the target of the political violence by politicians (von Borzyskowski and Kuhn 2020), and victims of political violence tend to support the violent candidate more (Gutiérrez-Romero and LeBas 2020). To test these possibilities, I divide samples according to residential area, the level of political interests, and the level of political sophistication. I measure the level of political sophistication by asking respondents three political questions related to the minimum age for voter registration, the number of members in the House of Representatives, and the presidential term. Then, I run logistic regression to see whether there appears similar pattern as I found in the previous section. As you can see from Figure H3 and Figure H4 in Appendix H, I find no evidence for this alternative explanations. Neither non-NCR residents who are more interested (or less interested) in the politics nor who are politically less sophisticated (or more sophisticated) tend to vote for the violent candidate when they receive foreign aid treatment. These results suggest that the main findings are robust to other possible alternative explanations.
I also test whether the findings are consistent with another common measure of one’s economic status, level of wealth. To capture this another dimension of economic well-being of the voters, I ask respondents to indicate whether they have the goods listed as follows: laptop, smartphone, a car, a house which you have finished paying for, and a house which you are paying for. This survey questionnaire is originally from World Value Survey Wave 7 (Haerpfer et al. 2020), and I modify it to appropriately reflect the context of the Philippines. I code the respondent to have house if she answered to have either a house which she finished paying for or a house which she is paying for, and calculate the total number of goods that respondents own. Then, after dividing the samples by their assigned treatment, residential area, and the number of owned goods, I run logistic regression. As you can see from the Figure H5 in Appendix H, I find that only non-NCR residents who own less than three listed goods are more likely to voting for a candidate who has offered foreign aid projects to her constituency, regardless of her alleged electoral violence. This results confirm that the main findings are not driven by specific measure of economic status of the voters. Rather, this supports my claim that the poverty and the level of local public goods matter for the effect of the foreign aid on the violent candidate’s electoral performance.
Lastly, one of direct implications from the theory is that there would be more electoral violence-related incidents in non-NCR than in NCR since poor voters in non-NCR are more willing to vote for violent candidate in the face of development projects. To see whether this is true, I calculate the number of electoral violence-related incidents per 1,000,000 people by regions for the 2007 and 2010 elections in the Philippines, using the Electoral Contention and Violence (ECAV) dataset (Daxecker, Amicarelli, and Jung 2019). In the 2007 election, the number of incidents per 1,000,000 people was 0.29 in NCR while the average number of incidents per 1,000,000 people in other regions was 0.34. In the 2010 election, the number of incidents per 1,000,000 people in NCR decreased to 0.22 while the average number of incidents per 1,000,000 people in other regions increased to 0.44, a figure that is twice bigger than that of NCR. Although this is simply descriptive comparison of the numbers without taking account for the magnitude of each incident, these figures show electoral violence-related incidents are more pervasive in the non-NCR than NCR.
Discussion
The main finding of this research is that foreign aid can increase the probability of voting for violent candidate in the region where local public goods are scarce and voters are poor. However, it is worth discussing the another finding from this research: in general, Filipino voters do punish violent candidate. As one can see from the both Figure 1 and Figure 2, once respondents got to know that the hypothetical candidate has rumor of using electoral violence, probability of voting for her drastically decreased. This result is in line with research illustrates Kenyan voters who expect greater benefits from the candidate (i.e., co-ethnic or co-partisan) still sanctions violent candidate in general (Gutiérrez-Romero and LeBas 2020). In fact, my finding illustrates this sanctioning effect is greater than the positive effect of foreign aid. Therefore, this finding implies that the violent candidate will have difficulty in gaining votes, which seems contradictory to reality, considering a lots of criminal or violent candidates keep winning seats in many of developing countries.
Although this finding does have implications on the reality, I believe this results in part might stem from the limitations of my experimental designs, especially related to external validity. I believe social desirability bias is clearly the one which results in making the effect of electoral violence treatment overly strong. In other words, despite a room for violent candidate to gain support from the voters in real world, my experiment might have muted this possibility. As I explained, I intentionally choose the rumor of ordering the assassination as a key message in the vignette because the main purpose of the research is to test whether foreign aid can have positive effect on the probability of voting for violent candidate. Since ordering the murder of a rival politician is the strongest allegation among various forms of electoral violence, I expected this setting would offer conservative test of my hypotheses. However, there was a trade-off in this strategy. On the one hand, I find that poor voters living in non-NCR will vote for foreign aid, regardless of candidate’s alleged electoral violence, and this implies in reality, they might be more willing to vote for violent or criminal candidate if she brings local benefits into the district. On the other hand, however, my finding also suggests that most respondents do not vote for violent candidate. Unfortunately, within current experimental design, I cannot further analyze to what extent the results reflect the reality, and to what extent the social desirability bias plays a role. Therefore, I expect more elaborated future research that can investigate how the effect of foreign aid can differ by different levels of violence or crime, and that is more realistic.
Despite these limitations, there are anecdotal evidences suggesting the main findings of this research might explain electoral success of violent candidates in the Philippines. For example, Carmen Loreto-Cari had served as 3-term congresswoman at Leyte’s 5th congressional district from 2010 to 2019 despite suspicion of masterminding for an assassination attempt against a rival politician in 2013. Leyte is one of poor provinces in the Philippines, whose economy is heavily dependent on farming and fishing. From 2014 to 2018, 5th district of Leyte had received 367 sub-projects of Kalahi-NCDDP worth 7.2 million dollars, which are the greatest amount among other four districts within Leyte. Local impacts of Kalahi-NCDDP was substantial during the period as well. For example, in 2015, electricity was first introduced in Himokilan, one of the villages (barangays) in 5th district of Leyte, thanks to Kalahi-NCDDP project.18 Also, in the other village of 5th district, Casulongan, health stations, constructed with Kalahi-NCDDP funds in 2012, have been an important bases in providing essential health services to residents. Especially, they have played a significant role in response to Super Typoon Haiyan in 2013 and to Covid-19 pandemic recently.19 In 2016 election, Loreto-Cari won a landslide victory with 91.8% of popular votes, and her grandson, Cari Nicolas Cellona Cari, successfully succeeded her seat in 2019.
Conclusion
In this paper, I address determinants of voting choice for the violent candidate in terms of foreign aid, economic status, and residential area. Rather than focusing on individualistic benefits that candidate might offer or voters’ economic status alone, my framework reveals how local benefits that a candidate might have no control influences voters differently by their economic status and residential area. I show violent candidate has incentives to claim credit for foreign aid, and poor voters living in regions where public goods are underprovided are more likely to cast a vote for her. I test the theory through the use of a survey experiment with a nationally representative sample of the Philippines. I find strong evidence that voters, who are living in non-NCR and have lower household income, are more likely to vote for a violence-related incumbent politician whose district was selected as foreign aid projects before. Further, I also demonstrate that these findings are robust to possible alternative explanations and measurements.
This work makes several contributions to the study of electoral violence and foreign aid. While numerous scholars have examined how clientelism or vote-buying affects the electoral success of the candidates with criminal or violent backgrounds, little work has focused on how local benefit or foreign aid affects them. I find evidence that foreign aid can provide opportunities for violent politicians to mitigate their negative characteristics and take credit for basic public goods and social services flowing into their district. Thus, the findings suggest that foreign aid can unintentionally lead to the electoral success of the violent legislators in developing countries.
In some developing country, poor voters punish candidate who promises to offer targeted goods such as bags of sugar and K500 bills while they reward candidate who promises to offer ‘community benefit’ such as schools and improved healthcare (Kao et al. 2017). In addition, some research also finds that citizens of recipients favor foreign aid projects than government programs, especially when they perceive the government as corrupt or clientelist (Milner et al. 2016). Therefore, these findings of previous research that the effect of foreign can be greater than typical tools of vote-buying used by criminal or violent politicians in developing world. In a similar vein, the findings of my research suggest that the success of violent candidates is likely to be driven by the presence of voters who are less likely to sanction violence, or who are more responsive to local benefits. In my experiment, they were poor voters living in non-NCR, who are the main beneficiaries of basic local public goods and social services that community-driven foreign aid project usually provides. In contrast to previous works focused on voters’ ethnicity or income level alone, this work implies there needs additional consideration, such as regional capacity for providing public goods, to analyze determinants of voting decision for the violent candidates in developing countries.
Overall, this research contributes to deepening our understanding of why violence-related politicians in developing countries keep gaining seats, and why voters continuously elect them. My experimental design reflects the trade-off that ordinary voters in developing countries would encounter every election, and therefore, I could find which type of voters are more willing to sacrifice non-violence for local benefits. This work also contributes to the study of electoral violence by providing a straightforward framework that future research might utilize. Since the evidence clearly shows voters are willing to vote for the violent candidate if she gives what they need, future research needs to find which types of voters demand what kinds of benefits. In my case, I start from the proposition that poor voters residing in non-NCR demand basic public goods and social services, and foreign aid can offer these local benefits. I believe future research can bear fruit by asking similar questions: for examples, which types of voters demand redistributive policies or foreign direct investment more.
- In this paper, electoral violence refers to purposeful influence of political actors in the process and outcome of elections, involving coercive acts against humans, property, and infrastructure (Birch et al. 2020).
- Rappler, July 14, 2016. “Negros Occidental lawmaker faces trial for extrajudicial killings.” https://www.rappler.com/nation/negros-occidental-lawmaker-charged-extrajudicial-killings (accessed December 19, 2021).
- Rappler, May 9, 2013. “We may kill her if she were winnable.” https://www.rappler.com/nation/elections/we-may-kill-her-if-she-were-winnable (accessed December 19, 2021).
- Government final consumption can be broken down into two distinct groups. The first reflects expenditures for collective consumption (defense, justice, etc.) which benefit society as a whole, or large parts of society, and are often known as public goods and services. The second relates to expenditures for individual consumption (health care, housing, education, etc.), that reflect expenditures incurred by government on behalf of an individual household. This category of expenditure is equal to social transfers in kind from government to households and so includes expenditure by government on market goods and services provided to households.
- Data for Bangladesh, Cambodia, and Laos is from WHO. https://apps.who.int/gho/data/view.main.HS07v (accessed December 17, 2021).
- Data for Thailand and Laos is from World Bank. https://data.worldbank.org/indicator/SE.PRM.ENRL.TC.ZS?locations=TH (accessed December 18, 2021)
- International Fund for Agricultural Development. 2013. “Community driven development IFAD’s engagement in community-driven development.” https://www.ifad.org/en/web/ioe/-/community-driven-development (accessed December 19, 2021).
- See https://www.worldbank.org/en/topic/communitydrivendevelopment#2 (accessed December 14, 2021).
- Poling, Gregory. 2013. “The 2013 Philippine Midterm Elections: Turning a Democratic Corner.” https://www.csis.org/analysis/2013-philippine-midterm-elections-turning-democratic-corner (accessed December 11, 2021).
- Caliwan, Christopher. 2019. “Election-related violence down by 60%: PNP.” https://www.pna.gov.ph/articles/1069778 (accessed December 18, 2021).
- World Bank database. https://data.worldbank.org/indicator/DT.ODA.ODAT.GN.ZS?locations=PH&most_recent_value_desc=false (accessed December 15, 2021).
- Philippine Statistics Authority. https://psa.gov.ph/ (accessed December 18, 2021).
- As I explain in next section, these projects aim to fund the local level public infrastructure and services such as roads, bridges, schools, daycare centers, etc.
- Official website for community-driven development projects (Kalahi-CIDSS) https://ncddp.dswd.gov.ph/ (accessed December 19, 2021).
- World Bank project specifications. https://projects.worldbank.org/en/projects-operations/document-detail/P127741 (accessed December 19, 2021).
- Regardless of candidate’s explicit appeal to voters or not, my theoretical prediction is that the voters will link her receipt of foreign aid to her performance. In this case, treatment with no explicit explanation on candidate’s role in achieving aid project would enable me to do more conservative test for the positive effect of foreign aid on probability of voting for candidate.
- covariates included in the regression model are age, gender, household monthly income, education level, ethnicity, residential area, job status, political interest, political knowledge, voting in last election, experience of political violence, government evaluation.
- Official website for Kalahi-CIDSS. https://ncddp.dswd.gov.ph/site/feature_profile/171 (accessed December 19, 2021)
- https://reliefweb.int/report/philippines/casulongan-moving-forward (accessed December 19, 2021)
References
ACE. 2007. “Understanding the Election-related Violent Incidence of 2007.”
Ahmed, Faisal Z. 2012. “The Perils of Unearned Foreign Income: Aid, Remittances, and Government Survival.” American Political Science Review 106(1): 146–65.
Alesina, Alberto, and Eliana La Ferrara. 2005. “Preferences for Redistribution in the Land of Opportunities.” Journal of Public Economics 89(5–6): 897–931.
Bailey, M. 2001. “Quiet influence: the representation of diffuse interests on trade policy, 1983-1994. Legislative Studies Quarterly, 45-80.
Banerjee, Abhijit, Donald P. Green, Jeffery McManus, and Rohini Pande. 2014. “Are Poor Voters Indifferent to Whether Elected Leaders Are Criminal or Corrupt? A Vignette Experiment in Rural India.” Political Communication 31(3): 391–407.
Besaw, Clayton., Frank, Matthew. 2021. ELection VIolence (ELVI) Indicators and Forecast Dataset. Broomfield, CO: One Earth Future.
Birch, Sarah, Ursula Daxecker, and Kristine Höglund. 2020. “Electoral Violence: An Introduction.” Journal of Peace Research 57(1): 3-14.
Carnegie, Allison, and Nikolay Marinov. 2017. “Foreign Aid, Human Rights, and Democracy Promotion: Evidence from a Natural Experiment.” American Journal of Political Science 61(3): 671-683.
Chandra, Kanchan. 2004. Why Ethnic Parties Succeed: Patronage and Ethnic Head Counts in India. Cambridge: Cambridge University Press.
Chaturvedi, Ashish. 2005. “Rigging elections with violence.” Public Choice 125(1–2): 189–202.
Collier, Paul, and Pedro C Vicente. 2013. “Votes and Violence: Evidence from a Field Experiment in Nigeria.” The Economic Journal 124(February): 327-355.
Cruz, Cesi, and Christina J. Schneider. 2017. “Foreign Aid and Undeserved Credit Claiming.” American Journal of Political Science 61(2): 396–408.
Cummings, Ronald G., Glenn W. Harrison, and E. Elisabet Rutström. 1995. “Homegrown Values and Hypothetical Surveys: Is the Dichotomous Choice Approach Incentive-Compatible?” The American Economic Review 85(1): 260–66.
Daxecker, Ursula, Amicarelli, Elio, and Alexander Jung, 2019. “Electoral contention and violence (ECAV): A new dataset.” Journal of Peace Research 56(5): 714-723.
Denzau, A. and M. Munger 1986. “Legislators and interest groups: how unorganized interests get represented.” American Political Science Review 80, 89-106.
Dreher, Axel, Fuchs, Andreas, Hodler, Roland, Parks, Bradley, Raschky, Paul, and Michael Tierney. 2019. “Political bias and the economic impact of Chinese aid.” Voxeu.org.
Edillon Rosemarie, Sharon Faye Piza, Carlos Abad Santos, Regina Baroma, Francis Alan Piza, Donna Mae Odra, Charisse Agorilla, Aiza Villamore, Sharon Fangonon, Jose Rowell Corpuz, and Faith Hyacinth Balisacan. 2011. “Final Survey for the KALAHI-CIDSS Impact Evaluation.” World Bank.
Keefer, Philip, and Stuti Khemani. 2005. “Democracy, Public Expenditures, and the Poor: Understanding Political Incentives for Providing Public Services.” The World Bank Research Observer 20(1): 1–27.
Kitschelt, H. 2000. Linkages between Citizens and Politicians in Democratic Politics, Comparative Political Studies 33: 845-879.
Gutiérrez-Romero, Roxana, and Adrienne LeBas. 2020. “Does Electoral Violence Affect Vote Choice and Willingness to Vote? Conjoint Analysis of a Vignette Experiment.” Journal of Peace Research 57(1): 77-92.
Haerpfer, C., Inglehart, R., Moreno, A., Welzel, C., Kizilova, K., Diez-Medrano J., M. Lagos, P. Norris, E. Ponarin & B. Puranen et al. (eds.). 2020. World Values Survey: Round Seven – Country-Pooled Datafile. Madrid, Spain & Vienna, Austria: JD Systems Institute & WVSA Secretariat. doi.org/10.14281/18241.13
Hafner-Burton, Emilie M., Susan D. Hyde, and Ryan S. Jablonski. 2014. “When do governments resort to election violence?” British Journal of Political Science 44(1): 149–179.
Inglehart, Ronald. 2007. Postmaterialist Values and the Shift from Survival to Self‐Expression Values. In Russel J. Dalton and Hans-Dieter Klingemann (Ed.), The Oxford Handbook of Political Behavior. Oxford University Press.
Jablonski, Ryan S. 2014. “How Aid Targets Votes: The Impact of Electoral Incentives on Foreign Aid Distribution.” World Politics 66(2): 293–330.
Jensen, Nathan M., Edmund Malesky, Mariana Medina, and Ugur Ozdemir. 2014. “Pass the Bucks: Credit, Blame, and the Global Competition for Investment.” International Studies Quarterly 58(3): 433–47.
Jensen, Peter Sandholt, and Mogens K. Justesen. 2014. “Poverty and Vote Buying: Survey-Based Evidence from Africa.” Electoral Studies 33: 220–32.
Knutsen, Tora, and Andreas Kotsadam. 2020. “The Political Economy of Aid Allocation: Aid and Incumbency at the Local Level in Sub Saharan Africa.” World Development 127: 1-9.
Lynch, Gabrielle. 2014. “Electing the ‘alliance of the accused’: The success of the Jubilee Alliance in Kenya’s Rift Valley.” Journal of Eastern African Studies 8(1): 93–114.
Mansuri, Ghazala and Vijayendra Rao. 2004. “Community-Based and -Driven Development: A Critical Review.” World Bank Policy Research Working Paper 3209.
Milner, Helen V. and Dustin H. Tingley. 2010. “The Political Economy of U.S. Foreign Aid: American Legislators and the Domestic Politics of Aid.” Economics & Politics 22(2): 200-232.
Milner, Helen V., Nielson, Daniel L., and Michael G. Findley. 2016. “Citizen preferences and public goods: comparing preferences for foreign aid and government programs in Uganda.” Review of International Organization 11: 219-245.
Mitra, Rajarshi and Md. Sharif Hossain. 2013. “Foreign Aid and Economic Growth in the Philippines.” Economics Bulletin 33(3): 1706-1714.
Nathan, Noah L. 2016. “Does Participation Reinforce Patronage? Policy Preferences, Turnout and Class in Urban Ghana.” British Journal of Political Science 49(1): 229–55.
Patino, Patrick and Djorina Velasco. 2004. “Election Violence in the Philippines.” Friedrich Ebert Stiftung Philippine Office.
Stokes, C. Stokes. 2009. Political Clientelism. In Carles Boix and Susan C. Stokes (Ed.), The Oxford Handbook of Comparative Politics, Oxford University Press.
Stokes, C. Stokes, Dunning, T., Nazareno, M., and Brusco, V. 2013, Brokers, Voters, and Clientelism: The puzzle of distributive politics, Cambridge University Press.
Weitz-Shapiro, Rebecca. 2012. “What wins votes: Why some politicians opt out of clientelism.” American Journal of Political Science 56(3): 568–583.
Winters, Matthew S. and Rebecca Weitz-Shapiro. 2013. “Lacking information or condoning corruption: When do voters support corrupt politicians?” Comparative Politics 45(4): 418–436.
World Bank. 2014. “International Bank for Reconstruction and Development Project Appraisal Document on a Proposed Loan in the Amount of US$479.0 Million to the Republic of the Philippines for a KALAHI-CIDSS National Community Driven Development Project.”
von Borzyskowski, Inken, and Patrick M Kuhn. 2020. “Dangerously Informed: Voter Information and Pre-Electoral Violence in Africa.” Journal of Peace Research 57(1): 15–29.
Appendix
Appendix A. Summary statistics of respondents
| Variable names | N | Min | Max | Mean | Standard deviation |
| Age | 1632 | 20 | 76 | 40.12 | 13.86 |
| Female | 1632 | 0 | 1 | 0.49 | 0.50 |
| Education | 1632 | 0 | 5 | 3.95 | 1.07 |
| Household monthly income | 1632 | 0 | 6 | 2.58 | 1.97 |
| Tagalog | 1615 | 0 | 1 | 0.49 | 0.50 |
| Urban | 1632 | 0 | 1 | 0.73 | 0.45 |
| Permanent Job | 1632 | 0 | 1 | 0.33 | 0.47 |
| Employer | 1632 | 0 | 1 | 0.16 | 0.36 |
| Political knowledge | 1632 | 0 | 3 | 2.24 | 0.68 |
| Political interest | 1614 | 0 | 4 | 2.90 | 0.97 |
| Vote in 2019 General Election | 1632 | 0 | 1 | 0.71 | 0.45 |
| Experience of political violence | 1587 | 0 | 1 | 0.26 | 0.44 |
| Positive evaluation of the Philippine government | 1587 | 0 | 3 | 1.67 | 0.93 |
| Residence area (National Capital Region) | 1632 | 0 | 1 | 0.37 | 0.48 |
| Residence area (Central Visayas) | 1632 | 0 | 1 | 0.08 | 0.27 |
| Residence area (Eastern Visayas) | 1632 | 0 | 1 | 0.01 | 0.12 |
| Residence area (Zamboanga Peninsula) | 1632 | 0 | 1 | 0.01 | 0.10 |
| Residence area (Northern Mindanao) | 1632 | 0 | 1 | 0.02 | 0.15 |
| Residence area (Davao) | 1632 | 0 | 1 | 0.04 | 0.21 |
| Residence area (Soccsksrgen) | 1632 | 0 | 1 | 0.01 | 0.09 |
| Residence area (Caraga) | 1632 | 0 | 1 | 0.01 | 0.11 |
| Residence area (ARMM) | 1632 | 0 | 1 | 0.00 | 0.06 |
| Residence area (Cordillera Administrative Region) | 1632 | 0 | 1 | 0.02 | 0.13 |
| Residence area (Ilocos) | 1632 | 0 | 1 | 0.03 | 0.18 |
| Residence area (Cagayan Valley) | 1632 | 0 | 1 | 0.01 | 0.09 |
| Residence area (Central Luzon) | 1632 | 0 | 1 | 0.10 | 0.30 |
| Residence area (Calabarzon) | 1632 | 0 | 1 | 0.19 | 0.39 |
| Residence area (Mimaropa) | 1632 | 0 | 1 | 0.01 | 0.09 |
| Residence area (Bicol) | 1632 | 0 | 1 | 0.03 | 0.16 |
| Residence area (Western Visayas) | 1632 | 0 | 1 | 0.04 | 0.20 |
Appendix B. English and Filipino version of the experimental vignettes
Table B1. English version of the experimental vignettes
| Baseline
(No mention about electoral violence nor foreign aid) |
“Imagine that there is a candidate for the 2022 House of Representatives elections in your constituency. This candidate has been elected member of the House before in another constituency similar to yours in the 2019 elections, and the candidate is promising to improve the economy of your community.” |
| Manipulation I.
(No mention about electoral violence & mention about foreign aid) |
“Imagine that there is a candidate for the 2022 House of Representatives elections in your constituency. This candidate has been elected member of the House before in another constituency similar to yours in the 2019 elections, and the candidate is promising to improve the economy of your community. Last year, this candidate’s current electoral district was selected for a Community Driven Development Project by the World Bank. The project spent 200,000 US dollars (more than 9 million pesos) to provide and improve access services such as village roads and footbridge, and basic social services such as day care center, classroom, and health station.” |
| Manipulation II. (Rumor to use electoral violence & no mention about foreign aid) | “Imagine that there is a candidate for the 2022 House of Representatives elections in your constituency. This candidate has been elected member of the House before in another constituency similar to yours in the 2019 elections, and the candidate is promising to improve the economy of your community. This candidate is rumored to have ordered the murder of a rival politician to win the 2019 election. This candidate has not been arrested for the alleged crime.” |
| Manipulation III. (Rumor to use electoral violence & mention about foreign aid) | “Imagine that there is a candidate for the 2022 House of Representatives elections in your constituency. This candidate has been elected member of the House before in another constituency similar to yours in the 2019 elections, and the candidate is promising to improve the economy of your community. Last year, this candidate’s current electoral district was selected for a Community Driven Development Project by the World Bank. The project spent 200,000 US dollars (more than 9 million pesos) to provide and improve access services such as village roads and footbridge, and basic social services such as day care center, classroom, and health station. This candidate is rumored to have ordered the murder of a rival politician to win the 2019 election. This candidate has not been arrested for the alleged crime.” |
Table B2. Filipino version of the experimental vignettes
| Baseline
(No mention about electoral violence nor foreign aid) |
“Kunwari, may isang kandidato sa iyong lugar para sa eleksyon sa Kongreso sa 2022. Nahalal na ang kandidatong ito sa Kongreso noong eleksyon 2019 sa isang lugar na may parehong sitwasyon ng lugar mo at ipinapangako ng kandidatong ito na palalaguin niya ang ekonomiya ng iyong komunidad.” |
| Manipulation I.
(No mention about electoral violence & mention about foreign aid) |
“Kunwari, may isang kandidato sa iyong lugar para sa eleksyon sa Kongreso sa 2022. Nahalal na ang kandidatong ito sa Kongreso noong eleksyon 2019 sa isang lugar na may parehong sitwasyon ng lugar mo at ipinapangako ng kandidatong ito na palalaguin niya ang ekonomiya ng iyong komunidad. Noong nakaraang taon, napili ang kasalukuyang distrito ng kandidatong ito para sa Proyekto para sa Pagpapaunlad ng Komunidad ng World Bank. 200,000 US dollars (mahigit 9 milyong piso) ang ginastos sa proyekto para magbigay at mapabuti ang akses sa mga serbisyo tulad ng mga daan sa kanayunan at tulay para sa tao, at pangunahing serbisyong panlipunan tulad ng daycare center, silid-aralan, at pagamutan o health center.” |
| Manipulation II. (Rumor to use electoral violence & no mention about foreign aid) | “Kunwari, may isang kandidato sa iyong lugar para sa eleksyon sa Kongreso sa 2022. Nahalal na ang kandidatong ito sa Kongreso noong eleksyon 2019 sa isang lugar na may parehong sitwasyon ng lugar mo at ipinapangako ng kandidatong ito na palalaguin niya ang ekonomiya ng iyong komunidad. Usap-usapang pinapatay ng kandidatong ito ang kalabang pulitiko para manalo sa eleksyon noong 2019. Hindi naaresto ang kandidatong ito para sa bintang na krimen.” |
| Manipulation III. (Rumor to use electoral violence & mention about foreign aid) | “Kunwari, may isang kandidato sa iyong lugar para sa eleksyon sa Kongreso sa 2022. Nahalal na ang kandidatong ito sa Kongreso noong eleksyon 2019 sa isang lugar na may parehong sitwasyon ng lugar mo at ipinapangako ng kandidatong ito na palalaguin niya ang ekonomiya ng iyong komunidad. Noong nakaraang taon, napili ang kasalukuyang distrito ng kandidatong ito para sa Proyekto para sa Pagpapaunlad ng Komunidad ng World Bank. 200,000 US dollars (mahigit 9 milyong piso) ang ginastos sa proyekto para magbigay at mapabuti ang akses sa mga serbisyo tulad ng mga daan sa kanayunan at tulay para sa tao, at pangunahing serbisyong panlipunan tulad ng daycare center, silid-aralan, at pagamutan o health center. Usap-usapang pinapatay ng kandidatong ito ang kalabang pulitiko para manalo sa eleksyon noong 2019. Hindi naaresto ang kandidatong ito para sa bintang na krimen.” |
Appendix C. Randomization check (ANOVA)
|
Variable names |
Mean (standard deviation) in each condition |
F |
Prob> F |
|||
| Baseline | Foreign aid condition | Electoral violence condition | Foreign aid & electoral violence condition | |||
| Age | 40.60 (13.88) | 40.00 (13.89) | 38.94 (13.56) | 41.01 (14.08) | 1.73 | 0.158 |
| Female | 0.47 (0.50) | 0.49 (0.50) | 0.49 (0.50) | 0.52 (0.50) | 0.86 | 0.46 |
| Household monthly income | 3.71 (1.97) | 3.55 (1.97) | 3.55 (1.97) | 3.51 (1.97) | 0.79 | 0.49 |
| Education | 3.98 (1.05) | 3.97 (1.07) | 3.93 (1.06) | 3.89 (1.08) | 0.60 | 0.62 |
| Tagalog | 0.54 (0.50) | 0.49 (0.50) | 0.51 (0.50) | 0.40 (0.49) | 5.40 | 0.00* |
| Urban | 0.73 (0.44) | 0.71 (0.45) | 0.73 (0.44) | 0.72 (0.45) | 0.13 | 0.94 |
| Permanent job | 0.33
(0.47) |
0.34
(0.47) |
0.34
(0.47) |
0.29
(0.45) |
1.09 | 0.35 |
| Employer | 0.17
(0.37) |
0.14
(0.35) |
0.17
(0.37) |
0.15
(0.35) |
0.59 | 0.62 |
| Political interest | 2.91 (0.94) | 2.86 (0.98) | 2.90 (0.96) | 2.94 (0.99) | 0.50 | 0.68 |
| Political knowledge | 2.23 (0.68) | 2.18 (0.69) | 2.24 (0.71) | 2.28 (0.65) | 1.59 | 0.19 |
| Vote in 2019 General Election | 0.72 (0.45) | 0.71 (0.45) | 0.72 (0.45) | 0.70 (0.46) | 0.14 | 0.94 |
| Experience of political violence | 0.27 (0.44) | 0.26 (0.44) | 0.25 (0.44) | 0.25 (0.43) | 0.11 | 0.95 |
| Positive evaluation of the Philippine government | 1.65 (0.93) | 1.66 (0.94) | 1.65 (0.90) | 1.71 (0.94) | 0.38 | 0.77 |
| Residence area (National Capital Region) | 0.38 (0.48) | 0.36 (0.48) | 0.39 (0.49) | 0.36 (0.48) | 0.36 | 0.78 |
| Residence area (Cordillera Administrative Region) | 0.08 (0.28) | 0.07 (0.26) | 0.80 (0.27) | 0.07 (0.26) | 0.22 | 0.88 |
| Residence area (Ilocos) | 0.01 (0.09) | 0.02 (0.13) | 0.01 (0.12) | 0.02 (0.14) | 0.82 | 0.48 |
| Residence area (Cagayan Valley) | 0.01
(0.01) |
0.01
(0.09) |
0.01
(0.11) |
0.01
(0.12) |
0.38 | 0.76 |
| Residence area (Central Luzon) | 0.02
(0.13) |
0.02
(0.15) |
0.02
(0.15) |
0.02
0.15 |
0.10 | 0.95 |
| Residence area (Calabarzon) | 0.04
(0.19) |
0.04
(0.20) |
0.05
(0.21) |
0.04
(0.21) |
0.07 | 0.97 |
| Residence area (Mimaropa) | 0.01
(0.10) |
0.00
(0.05) |
0.01
(0.10) |
0.01
(0.11) |
0.91 | 0.43 |
| Residence area (Bicol) | 0.02
(0.14) |
0.01
(0.11) |
0.01
(0.01) |
0.01
(0.10) |
0.95 | 0.42 |
| Residence area (Western Visayas) | – | 0.01
(0.10) |
0.00
(0.05) |
– | 2.90 | 0.03 |
| Residence area (Central Visayas) | 0.17
(0.13) |
0.02
(0.13) |
0.01
(0.11) |
0.02
(0.14) |
0.27 | 0.84 |
| Residence area (Eastern Visayas) | 0.03
(0.16) |
0.04
(0.19) |
0.04
(0.18) |
0.04
(0.20) |
0.24 | 0.87 |
| Residence area (Zamboanga Peninsula) | 0.12
(0.11) |
0.01
(0.11) |
0.01
(0.07) |
0.01
(0.07) |
0.87 | 0.45 |
| Residence area (Northern Mindanao) | 0.11
(0.31) |
0.10
(0.30) |
0.11
(0.31) |
0.09
(0.28) |
0.49 | 0.68 |
| Residence area (Davao) | 0.19
(0.49) |
0.21
(0.41) |
0.18
(0.38) |
0.18
(0.39) |
0.75 | 0.52 |
| Residence area (Soccsksrgen) | 0.00
(0.07) |
0.01
(0.10) |
0.00
(0.07) |
0.01
(0.10) |
0.47 | 0.70 |
| Residence area (Caraga) | 0.02
(0.15) |
0.03
(0.16) |
0.03
(0.18) |
0.03
(0.15) |
0.28 | 0.83 |
| Residence area (ARMM) | 0.04
(0.20) |
0.03
(0.17) |
0.03
(0.17) |
0.06
(0.25) |
2.63 | 0.05 |
* p<0.05
Appendix D. The mean comparison of the dependent variable by treatment conditions
Figure D1. The proportion of respondents who vote for the candidate
Table D1. Two sample t-test results for mean value of Vote by treatment conditions, residential area, and household monthly income level
| Mean value of Vote | |||||||
| Residential area | Income level | Baseline | Aid only | Violence only | Aid and Violence | Mean difference | |
| NCR | poor | .580 | .866 | .286** | Mean difference between ‘Aid only’ group and ‘Baseline’ | ||
| rich | .589 | .725 | .136 | ||||
| non-NCR | poor | .616 | .742 | .126* | |||
| rich | .618 | .750 | .132 | ||||
| NCR | poor | .219 | .164 | -.055 | Mean difference between ‘Aid and Violence’ group and ‘Violence only’ group | ||
| rich | .120 | .135 | .015 | ||||
| non-NCR | poor | .110 | .213 | .104* | |||
| rich | .091 | .105 | .015 | ||||
* p<0.05, ** p<0.01
Appendix E. Marginal effect of each treatment on the probability of voting (logistic regression)
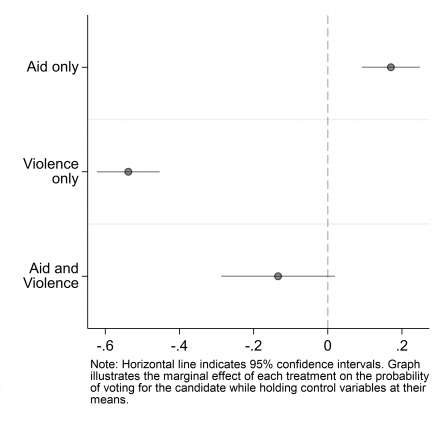
Appendix F. Logistic regression results for Figure 2 and Table 1
| (1)
NCR & low income |
(2)
NCR & high income |
(3)
non-NCR & low income |
(4)
non-NCR & high income |
|
| Foreign aid | 1.45* (0.62) |
0.92* (0.45) |
0.76* (0.36) |
1.22* (0.49) |
| Electoral violence | -2.20*** (0.54) |
-3.11*** (0.52) |
-3.03*** (0.45) |
-4.22*** (0.64) |
| Foreign aid X Electoral violence | -1.95* (0.87) |
-0.51 (0.70) |
0.31 (0.57) |
-0.84 (0.80) |
| Age | -0.04* (0.02) |
-0.03* (0.01) |
0.00 (0.01) |
-0.04* (0.02) |
| Female | 0.26 (0.43) |
0.02 (0.37) |
-0.49 (0.28) |
0.24 (0.38) |
| Education | -0.15 (0.18) |
-0.80** (0.28) |
-0.03 (0.13) |
-0.44 (0.25) |
| Household monthly income | 0.02 (0.33) |
0.17 (0.15) |
-0.82*** (0.21) |
-0.04 (0.17) |
| Tagalog | 0.76 (0.47) |
0.52 (0.37) |
0.30 (0.37) |
-0.48 (0.49) |
| Urban | -0.47 (0.56) |
-0.08 (0.64) |
0.31 (0.29) |
0.54 (0.43) |
| Permanent Job | -0.46 (0.50) |
0.24 (0.42) |
0.59 (0.34) |
0.08 (0.44) |
| Employer | 0.21 (0.57) |
1.17* (0.53) |
0.72 (0.48) |
1.04 (0.56) |
| Political knowledge | -0.29 (0.34) |
0.12 (0.28) |
0.06 (0.22) |
-0.71** (0.28) |
| Political interest | -0.15 (0.25) |
0.22 (0.24) |
0.27 (0.15) |
-0.28 (0.25) |
| Vote in 2019 General Election | 0.57 (0.50) |
0.17 (0.46) |
0.33 (0.32) |
0.81 (0.47) |
| Experience of political violence | 0.73 (0.47) |
0.38 (0.40) |
0.35 (0.32) |
0.64 (0.48) |
| Positive evaluation of the Philippine government | 0.36 (0.26) |
0.58* (0.23) |
0.22 (0.18) |
0.04 (0.25) |
| Constant | 2.65 (1.95) |
0.68 (2.07) |
-1.15 (1.25) |
2.36 (1.85) |
| N | 189 | 284 | 409 | 322 |
| Log likelihood | -81.51 | -116.71 | -181.78 | -106.84 |
| Region fixed effects | No | No | Yes | Yes |
Standard errors in parentheses. Province dummies are excluded from the table.
* p<0.05, ** p<0.01, *** p<0.001
Appendix G. Indicators for capacity of providing public goods and social services by regions
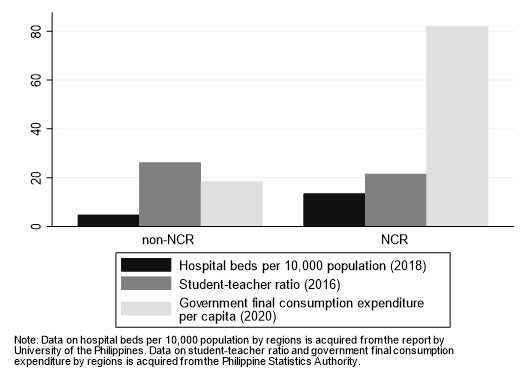
| Hospital beds per 10,000 population (2018) | Student-teacher ratio (2016) | Government final consumption expenditure per capita in Philippine Peso (2020) | |
| NCR | 13.5 | 21.5 | 82.1 |
| CAR | 6.5 | 25.3 | 27.9 |
| Region I – Ilocos | 4.8 | 24.9 | 20.6 |
| Region II – Cagayan Valley | 5.1 | 23.7 | 15.9 |
| Region III – Central Luzon | 5.0 | 26.3 | 15.5 |
| Region IV-A – Calabarzon | 5.3 | 27.4 | 12.8 |
| Region IV-B – Mimaropa | 1.0 | 26.9 | 17.5 |
| Region V – Bicol | 3.4 | 26.4 | 17.8 |
| Region VI – Western Visayas | 5.9 | 25.2 | 16.1 |
| Region VII – Central Visayas | 6.6 | 25.3 | 14.4 |
| Region VIII – Eastern Visayas | 2.8 | 26 | 23.9 |
| Region IX – Zamboanga Peninsula | 3.7 | 26.2 | 19.1 |
| Region X – Northern Mindanao | 6.4 | 25.7 | 21.8 |
| Region XI – Davao | 8.9 | 28.6 | 18.7 |
| Region XII – Soccsksrgen | 4.9 | 26.3 | 14.9 |
| Region XIII – Caraga | 3.8 | 25.4 | 18.9 |
| ARMM | 2.7 | 29.3 | 20.8 |
| National Average | 6.1 | 23.8 | 22.3 |
Note: Data on hospital beds per 10,000 population by regions is acquired from the report by University of the Philippines(https://up.edu.ph/estimating-local-healthcare-capacity-to-deal-with-covid-19-case-surge-analysis-and-recommendations/). Data on student-teacher ratio and government final consumption expenditure by regions is acquired from the Philippine Statistics Authority(https://openstat.psa.gov.ph/).
Appendix H. Robustness Checks
Figure H1. Marginal effect of foreign aid on the probability of voting for the candidate by treatment conditions, level of government final consumption expenditure per capita, and household monthly income level (samples are non-NCR respondents)
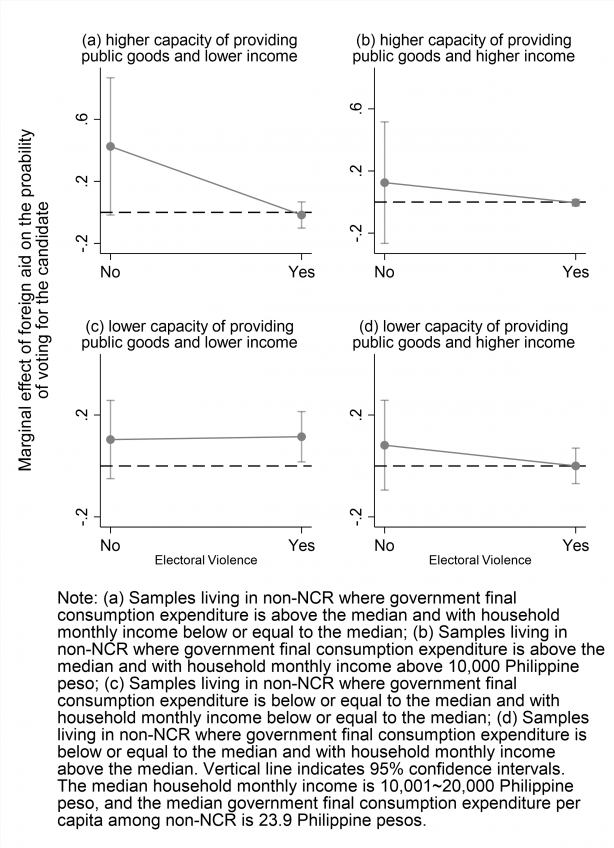
Table H1. Logistic regression results for Figure H1
| (1)
Upper-left panel |
(2)
Upper-right panel |
(3)
Lower-left panel |
(4)
Lower-right panel |
|
| Foreign aid | 4.26* (1.71) |
3.79 (2.15) |
0.48 (0.36) |
0.38 (0.42) |
| Electoral violence | -3.58* (1.68) |
-6.71* (3.27) |
-2.86*** (0.45) |
-3.40*** (0.61) |
| Foreign aid X Electoral violence | -4.94 (2.62) |
-4.47 (2.97) |
0.49 (0.56) |
-0.37 (0.79) |
| Government Final Consumption Expenditure per capita | -0.09 (0.34) |
0.02 (0.38) |
-0.06 (0.05) |
-0.19* (0.08) |
| Age | -0.01 (0.05) |
-0.07 (0.05) |
-0.01 (0.01) |
-0.02 (0.02) |
| Female | -1.40 (1.34) |
4.26 (2.49) |
-0.09 (0.28) |
0.04 (0.37) |
| Education | -1.10 (0.67) |
-0.21 (0.60) |
0.03 (0.13) |
-0.20 (0.25) |
| Household monthly income | -1.30 (0.86) |
0.95 (0.59) |
-0.60** (0.20) |
-0.18 (0.16) |
| Urban | 1.40 (1.27) |
-3.70 (2.36) |
0.17 (0.28) |
0.71 (0.41) |
| Permanent Job | 0.27 (1.51) |
2.42 (1.75) |
0.26 (0.34) |
-0.06 (0.43) |
| Employer | -4.17 (2.68) |
0.60 (1.88) |
0.90 (0.47) |
1.04 (0.54) |
| Political knowledge | 0.62 (1.02) |
2.08 (1.42) |
-0.08 (0.21) |
-0.68* (0.28) |
| Political interest | -0.03 (0.63) |
3.72 (2.16) |
0.35* (0.15) |
-0.12 (0.23) |
| Vote in 2019 General Election | -0.07 (1.20) |
-1.54 (1.80) |
0.55 (0.31) |
0.46 (0.44) |
| Experience of political violence | 1.30 (1.16) |
-6.66* (3.04) |
0.04 (0.32) |
0.70 (0.44) |
| Positive evaluation of the Philippine government | 1.12 (0.83) |
-0.36 (0.67) |
0.31* (0.16) |
0.44* (0.21) |
| Constant | 7.89 (8.73) |
-17.94 (16.35) |
0.71 (1.42) |
6.14** (2.28) |
| N | 78 | 88 | 358 | 272 |
| Log likelihood | -18.03 | -17.07 | -175.26 | -105.45 |
Standard errors in parentheses. * p<0.05, ** p<0.01, *** p<0.001
Figure H2. Marginal effect of foreign aid on the probability of voting for the candidate by level of government final consumption expenditure per capita and household monthly income level (samples are non-NCR respondents)
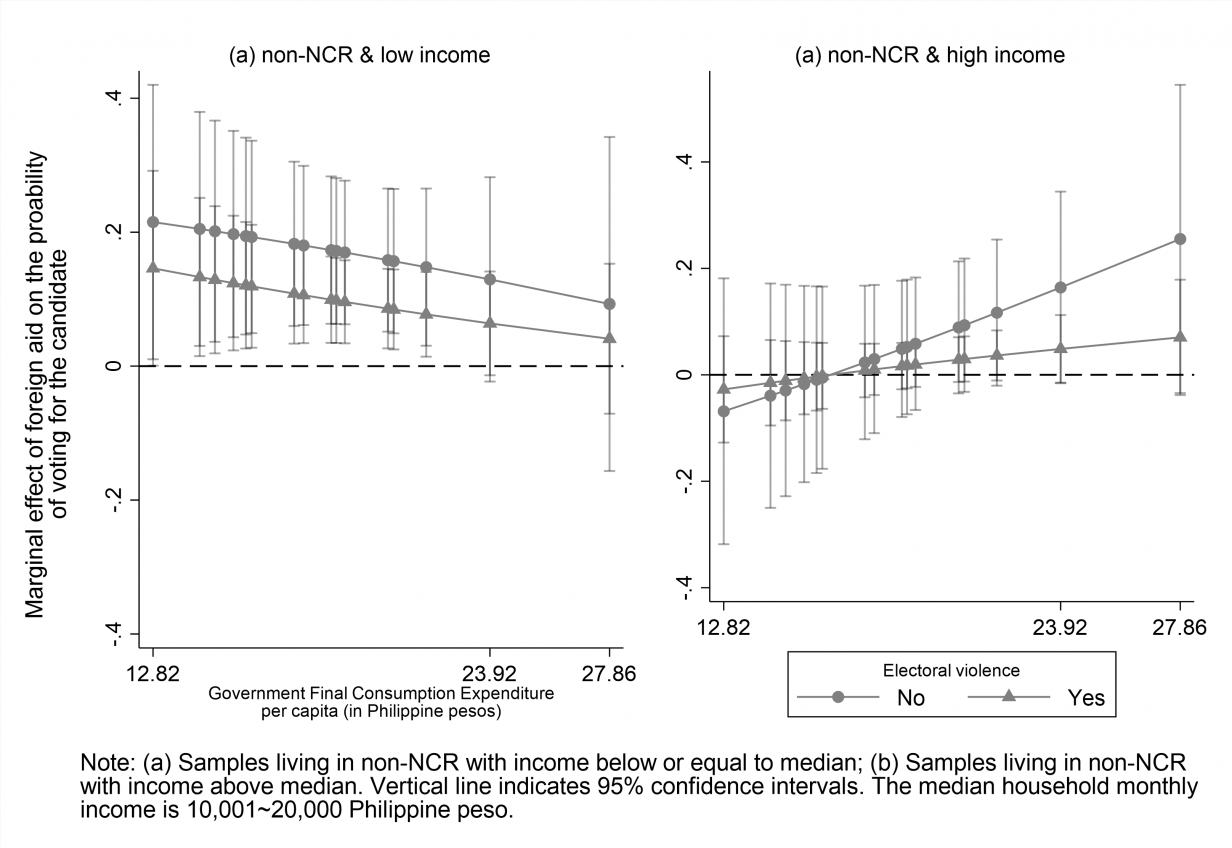
Table H2. Logistic regression results for Figure H2.
| (1)
non-NCR & low income |
(2)
non-NCR & high income |
|
| Foreign aid | 1.70 (1.31) |
-1.73 (1.72) |
| Government Final Consumption Expenditure per capita | -0.00 (0.05) |
-0.07 (0.06) |
| Foreign aid X Government Final Consumption Expenditure | -0.05 (0.06) |
0.11 (0.08) |
| Electoral violence | -2.70*** (0.27) |
-3.58*** (0.38) |
| Age | -0.00 (0.01) |
-0.02 (0.01) |
| Female | -0.24 (0.26) |
0.37 (0.32) |
| Education | -0.05 (0.12) |
-0.33 (0.21) |
| Household monthly income | -0.72*** (0.19) |
-0.17 (0.15) |
| Urban | 0.20 (0.26) |
0.70 (0.36) |
| Permanent Job | 0.48 (0.31) |
0.30 (0.38) |
| Employer | 0.81 (0.44) |
1.63*** (0.49) |
| Political knowledge | 0.02 (0.19) |
-0.66** (0.25) |
| Political interest | 0.30* (0.14) |
-0.18 (0.20) |
| Vote in 2019 General Election | 0.43 (0.29) |
0.83* (0.40) |
| Experience of political violence | 0.18 (0.29) |
0.22 (0.40) |
| Positive evaluation of the Philippine government | 0.32* (0.15) |
0.46* (0.18) |
| Constant | 0.01 (1.29) |
3.67* (1.78) |
| N | 436 | 339 |
| Log likelihood | -206.95 | -132.66 |
Figure H3. Marginal effects of foreign aid on the probability of voting for the candidate by treatment conditions, residential area, and the level of political interest
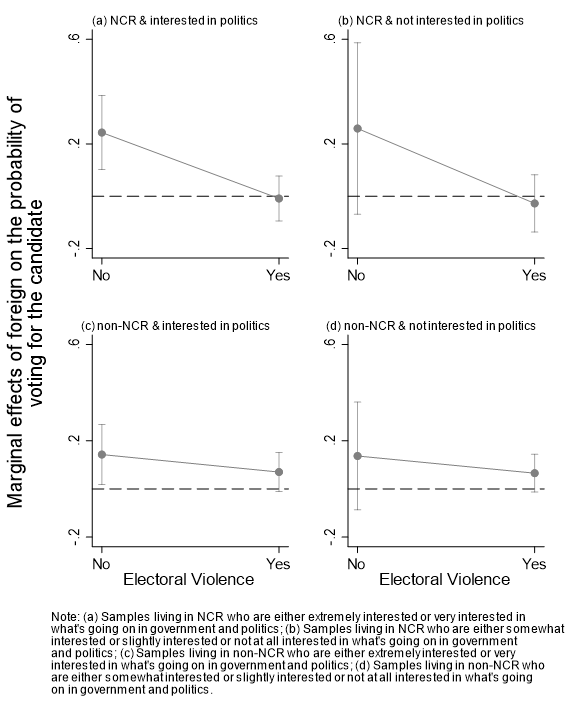
Table H3. Regression results for Figure H3
| (a) | (b) | (c) | (d) | |
| Foreign aid | 1.25** (0.39) |
1.37 (0.98) |
0.71* (0.32) |
0.64 (0.53) |
| Electoral violence | -2.33*** (0.39) |
-3.16*** (0.95) |
-2.84*** (0.37) |
-4.33*** (0.94) |
| Foreign aid X Electoral violence | -1.33* (0.57) |
-2.04 (1.70) |
-0.07 (0.49) |
0.86 (1.08) |
| Age | -0.03** (0.01) |
-0.04 (0.03) |
-0.01 (0.01) |
-0.00 (0.02) |
| Female | 0.12 (0.29) |
0.14 (0.81) |
-0.22 (0.24) |
0.49 (0.48) |
| Education | -0.39* (0.16) |
-0.55 (0.44) |
-0.09 (0.13) |
-0.42 (0.23) |
| Household monthly income | 0.09 (0.09) |
-0.22 (0.21) |
-0.08 (0.07) |
0.09 (0.12) |
| Tagalog | 0.82** (0.32) |
0.15 (0.76) |
-0.18 (0.32) |
0.45 (0.59) |
| Urban | -0.16 (0.43) |
-0.87 (1.03) |
0.13 (0.26) |
0.51 (0.47) |
| Permanent Job | -0.31 (0.35) |
0.24 (0.84) |
0.49 (0.29) |
-1.20 (0.62) |
| Employer | 0.74 (0.40) |
0.01 (1.16) |
0.85* (0.36) |
-0.08 (0.84) |
| Political knowledge | 0.04 (0.22) |
-0.50 (0.53) |
-0.32 (0.18) |
0.38 (0.38) |
| Political interest | 0.07 (0.29) |
0.36 (0.75) |
-0.03 (0.24) |
-0.79 (0.44) |
| Vote in 2019 General Election | 0.37 (0.39) |
0.62 (0.75) |
0.46 (0.30) |
0.52 (0.52) |
| Experience of political violence | 0.64* (0.32) |
-0.71 (0.91) |
0.22 (0.28) |
0.65 (0.61) |
| Positive evaluation of the Philippine government | 0.58** (0.18) |
0.39 (0.55) |
0.16 (0.16) |
0.48 (0.34) |
| Constant | 0.59 (1.56) |
4.88 (3.72) |
-0.72 (1.34) |
1.13 (1.87) |
| N | 385 | 88 | 517 | 215 |
| Log likelihood | -167.21 | -31.72 | -235.63 | -79.13 |
| Region fixed effects | No | No | Yes | Yes |
Standard errors in parentheses. Province dummies are excluded from the table.
* p<0.05, ** p<0.01, *** p<0.001
Figure H4. Marginal effects of foreign aid on the probability of voting for the candidate by treatment conditions, residential area, and the level of political sophistication
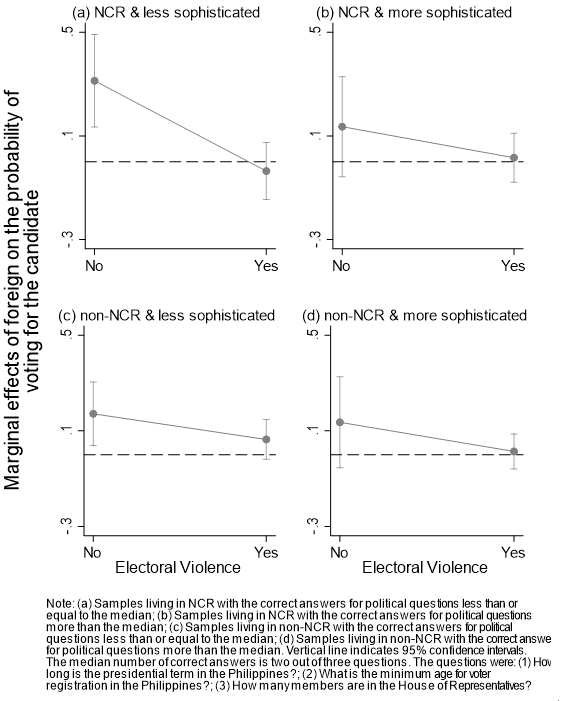
Table H4. Regression results for Figure H4
| (a) | (b) | (c) | (d) | |
| Foreign aid | 1.60** (0.49) |
0.70 (0.52) |
0.84* (0.33) |
0.73 (0.53) |
| Electoral violence | -1.97*** (0.47) |
-3.20*** (0.57) |
-2.82*** (0.42) |
-3.58*** (0.62) |
| Foreign aid X Electoral violence | -1.93** (0.72) |
-0.48 (0.82) |
-0.21 (0.55) |
-0.49 (0.83) |
| Age | -0.03 (0.01) |
-0.04* (0.02) |
-0.01 (0.01) |
-0.01 (0.02) |
| Female | 0.44 (0.35) |
-0.49 (0.44) |
0.02 (0.25) |
-0.69 (0.41) |
| Education | -0.34 (0.19) |
-0.34 (0.25) |
-0.25 (0.13) |
-0.15 (0.25) |
| Household monthly income | 0.02 (0.11) |
0.03 (0.13) |
0.02 (0.08) |
-0.28* (0.12) |
| Tagalog | 0.13 (0.39) |
1.31** (0.45) |
-0.23 (0.33) |
-0.30 (0.56) |
| Urban | -0.34 (0.49) |
0.45 (0.80) |
0.32 (0.27) |
-0.11 (0.43) |
| Permanent Job | -0.17 (0.44) |
-0.12 (0.50) |
-0.25 (0.31) |
0.65 (0.47) |
| Employer | 0.89 (0.50) |
0.39 (0.61) |
0.18 (0.41) |
1.58** (0.59) |
| Political knowledge | -0.21 (0.43) |
– | -0.40 (0.30) |
– |
| Political interest | 0.07 (0.20) |
0.21 (0.28) |
0.11 (0.14) |
-0.42 (0.28) |
| Vote in 2019 General Election | 0.14 (0.42) |
1.15 (0.60) |
0.37 (0.28) |
1.08* (0.55) |
| Experience of political violence | 0.53 (0.41) |
0.37 (0.46) |
0.21 (0.30) |
0.58 (0.47) |
| Positive evaluation of the Philippine government | 0.55* (0.23) |
0.49 (0.27) |
0.07 (0.16) |
0.24 (0.27) |
| Constant | 0.33 (1.71) |
0.63 (1.87) |
-0.14 (1.13) |
-0.16 (1.93) |
| N | 251 | 222 | 466 | 269 |
| Log likelihood | -110.12 | -88.15 | -213.33 | -97.49 |
| Region fixed effects | No | No | Yes | Yes |
Standard errors in parentheses. Province dummies are excluded from the table.
* p<0.05, ** p<0.01, *** p<0.001
Figure H5. Marginal effects of foreign aid on the probability of voting for the candidate by treatment conditions, residential area, and the level of wealth
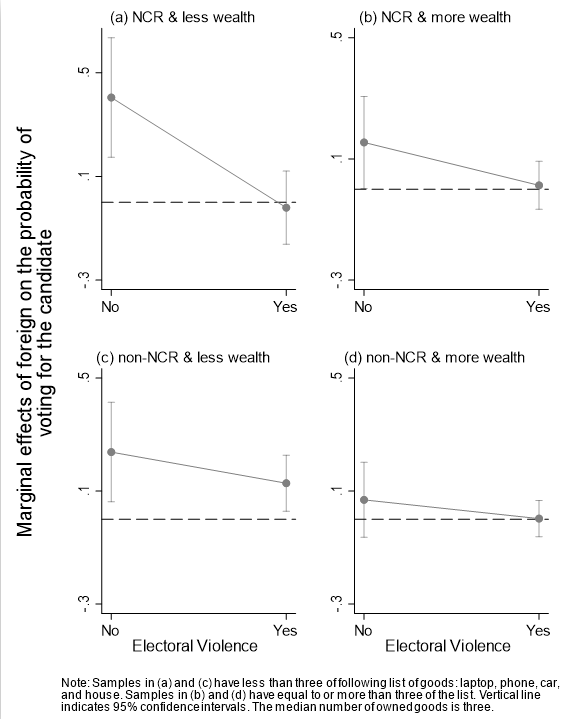
Table H5. Regression results for Figure H5
| (1) | (2) | (3) | (4) | |
| Foreign aid | 2.25** (0.77) |
0.80 (0.41) |
1.16* (0.45) |
0.35 (0.35) |
| Electoral violence | -1.93** (0.65) |
-3.02*** (0.46) |
-3.20*** (0.60) |
-3.37*** (0.45) |
| Foreign aid X Electoral violence | -2.45* (1.07) |
-0.64 (0.64) |
0.23 (0.74) |
-0.31 (0.59) |
| Age | -0.05* (0.02) |
-0.04** (0.01) |
-0.00 (0.01) |
-0.02 (0.01) |
| Female | 0.66 (0.52) |
-0.04 (0.33) |
-0.11 (0.35) |
-0.11 (0.28) |
| Education | -0.08 (0.23) |
-0.65** (0.22) |
-0.20 (0.16) |
-0.22 (0.17) |
| Household monthly income | -0.35* (0.17) |
0.21* (0.10) |
0.03 (0.12) |
-0.10 (0.08) |
| Tagalog | 0.62 (0.53) |
0.56 (0.36) |
-0.54 (0.45) |
0.27 (0.37) |
| Urban | -0.59 (0.67) |
-0.07 (0.51) |
-0.09 (0.33) |
0.45 (0.31) |
| Permanent Job | -0.42 (0.61) |
-0.09 (0.39) |
0.09 (0.44) |
0.16 (0.33) |
| Employer | 1.01 (0.76) |
0.62 (0.46) |
0.31 (0.69) |
0.84* (0.41) |
| Political knowledge | -0.16 (0.38) |
-0.06 (0.25) |
-0.19 (0.26) |
-0.25 (0.21) |
| Political interest | -0.11 (0.28) |
0.27 (0.22) |
-0.09 (0.17) |
0.15 (0.18) |
| Vote in 2019 General Election | 0.52 (0.55) |
0.16 (0.45) |
0.14 (0.36) |
0.69 (0.36) |
| Experience of political violence | 0.55 (0.62) |
0.63 (0.37) |
0.77* (0.39) |
0.19 (0.34) |
| Positive evaluation of the Philippine government | 0.38 (0.33) |
0.58** (0.20) |
0.56* (0.23) |
-0.14 (0.18) |
| Constant | 2.76 (2.42) |
1.23 (1.66) |
0.26 (1.39) |
-1.08 (1.44) |
| N | 140 | 333 | 301 | 435 |
| Log likelihood | -59.17 | -136.76 | -128.78 | -177.41 |
| Region fixed effects | No | No | Yes | Yes |